
What is data transformation?
Data transformation means changing how data looks, how it’s organized, or what it contains (data’s format, structure, or values). As a data analyst, we may need to do this to make data easier to analyze.
Data transformation involves:
- Adding, copying, or replicating data
- Removing fields or records
- Standardizing the names of variables
- Renaming, moving, or combining columns in a database
- Joining one set of data with another
- Saving a file in a different format. For example, saving a spreadsheet as a comma separated values (CSV) file.
Why transform data?
There are several reasons to transform data:
- Data organization: better organized data is easier to use
- Data compatibility: different applications or systems can then use the same data
- Data migration: data with matching formats can be moved from one system to another
- Data merging: data with the same organization can be merged together
- Data enhancement: data can be displayed with more detailed fields
- Data comparison: apples-to-apples comparisons of the data can then be made
Data transformation example: data merging
Let’s say Mario, a plumber, buys another plumbing company. He wants to combine customer information from both companies, but they use different databases. To make the data work together, Mario needs to transform it. He formats the data from the acquired company to match his own, removing any duplicate information. Once the data is compatible, Mario’s plumbing company will have a complete and combined customer database.
Data transformation example: data organization (long to wide)
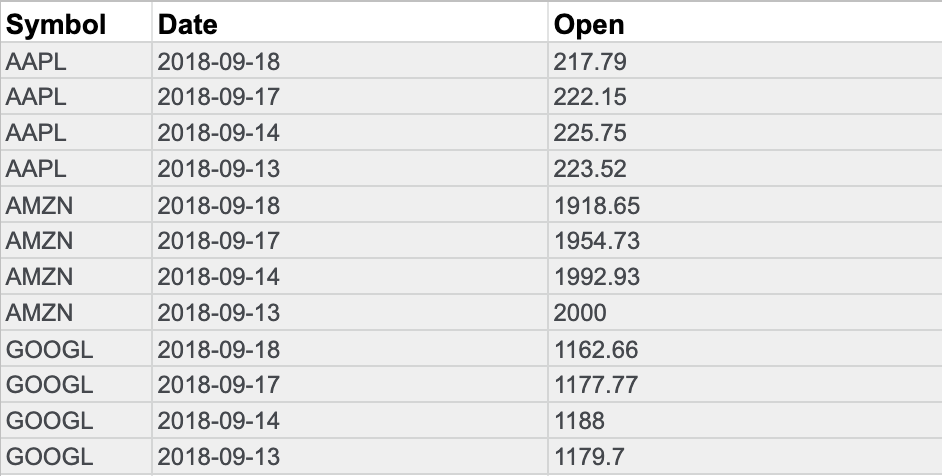
Sometimes, to create charts easily, we need to transform data from a long format to a wide format. For instance, consider transforming stock prices collected as long data into wide data.
Long data has each row representing a single data point for a specific item, like individual stock prices for Apple, Amazon, and Google on different dates. We can use Long Data when each row has one data point for an item.
Wide data has each row containing multiple data points for specific items, with columns representing each item (AAPL, AMZN, GOOGL). We can use Wide Data when eaach row has multiple data points for items identified in columns.
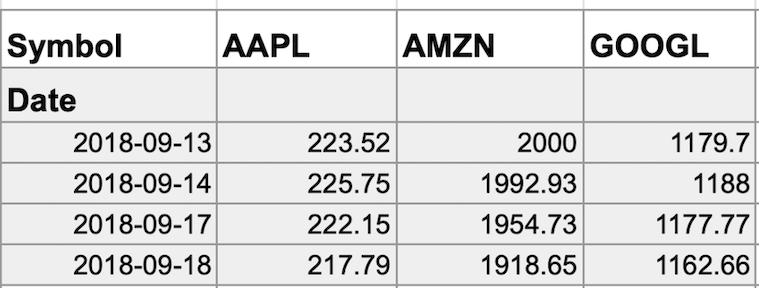
With data transformed to wide format, we can create a chart comparing how each company’s stock changed over time.
Long data is useful, but wide data is easier to read and understand. That’s why data analysts often transform long data to wide data. Here’s a summary of when to use each format:
| Wide data is preferred when | Long data is preferred when |
|---|---|
| Creating tables and charts with a few variables about each subject | Storing a lot of variables about each subject. For example, 60 years worth of interest rates for each bank |
| Comparing straightforward line graphs | Performing advanced statistical analysis or graphing |
Data transformation helps us get the most out of our data, making it accessible and insightful for analysis.